OEE Dashboard

Coperion C-Beyond

Get the most out of production data in extrusion or compounding.

Display, monitor, and analyze plant KPIs online and boost productivity with more informed decisions.

Instant insights from your production line

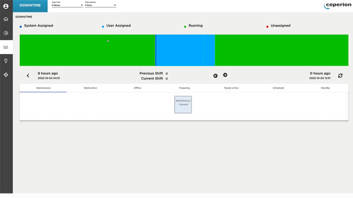
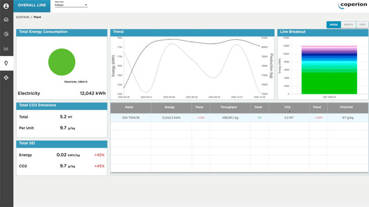
To help you continuously deliver the highest quality, reliable process data are indispensable. By aggregating and analyzing overall equipment effectiveness (OEE) data, production planners, decision-makers, and even line personnel will always have an overview of the current efficiency of their line. With OEE dashboard, they can identify trends and will have the necessary knowledge base for continuous improvement.

OEE dashboard is a key part of Coperion’s digital C-BEYOND platform. The data can be displayed via a secure VPN connection on any web browser. With comprehensive export and analytics features, OEE dashboard is the universal starting point for any kind of evaluation of your plant data.

OEE dashboard

Production data monitoring

The OEE live dashboard provides continuously updated information on the key performance indicators (KPIs) of the production line, such as availability, capacity and product quality, and enables tracing back of all production data. The OEE calculation is highly customizable to fit the operator’s requirements, whether a simple add-on board feed installed at the line for a general productivity overview or a sophisticated OEE analysis.

For further processing, for example, to integrate data into a presentation or spreadsheet, they can be conveniently exported at the push of a button. Also, for productivity analyses, historical data can be compared with current production data.

OEE indicators

OEE data help both operators and management to pinpoint productivity issues and track production history for events arising from changes in production. Making performance indicators available to operators increases transparency as never before. Experience shows that sharing performance indicators with your staff raises their level of commitment and consequently boosts productivity. And to ensure a smooth information flow between line personnel and management, OEE indicators provide uniform evaluation data at the management and detail level.

Tracking downtime

Production disruptions due to recipe changes or maintenance tasks are automatically recorded and can be evaluated in the OEE dashboard. For in-depth analyses, individual downtime categories can be configured. In case of machine failures, automatic messages are generated for management and service personnel, enabling faster reactions.

C-BEYOND is constantly in development and will provide even more insights to enhance compounding productivity in future updates. You can look forward to the following features soon:

  • Maintenance management

    For easy integration of maintenance management in the OEE analysis, operation-critical maintenance intervals will be recorded. The system will support preventive maintenance through fixed maintenance intervals as well as predictive maintenance through condition-based maintenance intervals.


  • Energy monitoring (Sustain App)

    Upcoming versions of the OEE dashboard will also record energy flows of the extrusion line. This function will allow for process analysis by evaluating the energy consumption data of individual assemblies, such as housing temperature.


Subscribe to the Coperion Newsletter